The velocity () versus time () plot of a particle is shown in the figure, for a time interval of 40 s. The total distance travelled by the particle and the average velocity during this period are, respectively ________.
← JEE Main 2026 · 5 Apr · Shift 2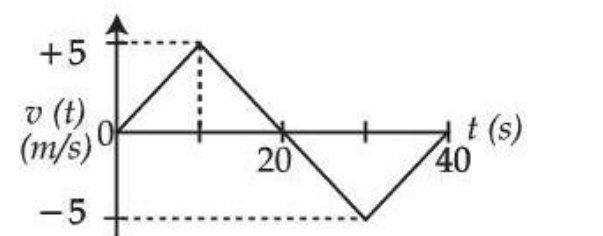
PhysicsSingle correct+4 / -1Question 29 of 75
JEE Main 2026 · 5 Apr · Shift 2, Physics question 29
Answer and worked solution
Official answer: C
Distance. The graph is four triangles, each of area m, so the distance is 100 m.
Displacement. The area above the axis cancels the area below it, so the displacement, and the average velocity, is zero.
(C)
Topics:Motion graphs