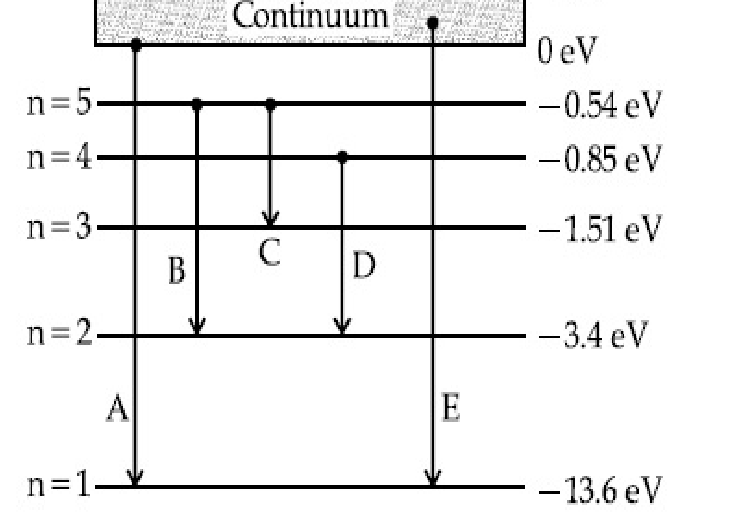
In the given figure, the energy levels of hydrogen atom have been shown along with some transitions marked A, B, C, D and E.
The transitions A, B and C respectively represent :
In the given figure, the energy levels of hydrogen atom have been shown along with some transitions marked A, B, C, D and E.
The transitions A, B and C respectively represent :
Official answer: D
Transitions. A: continuum → n = 1, the Lyman series limit. B: 5 → 2, the third Balmer line (after 3 → 2 and 4 → 2). C: 5 → 3, the second Paschen line (after 4 → 3).
(D)