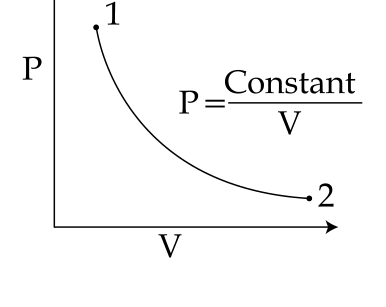
For the P-V diagram given for an ideal gas,
out of the following which one correctly represents the T-P diagram ?
For the P-V diagram given for an ideal gas,
out of the following which one correctly represents the T-P diagram ?
Official answer: C
is an isotherm, so T stays constant while P falls from 1 to 2. On a T-P plot that is a horizontal line with 2 at lower P than 1: graph (3).