Figure shows a circular area of radius R where a uniform magnetic field is going into the plane of paper and increasing in magnitude at a constant rate. In that case, which of the following graphs, drawn schematically, correctly shows the variation of the induced electric field E(r) ?
← JEE Main 2014 · 19 Apr · Shift 1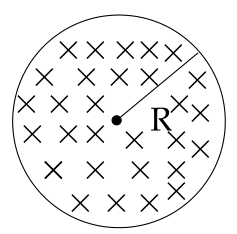
PhysicsSingle correct+4 / -1Question 21 of 90
JEE Main 2014 · 19 Apr · Shift 1, Physics question 21
Answer and worked solution
Official answer: A
By Faraday's law round a circle of radius : inside, so for .
Outside, , so . That is a linear rise to a peak at R, then a fall: graph (1).
Topics:Faraday's and Lenz's laws