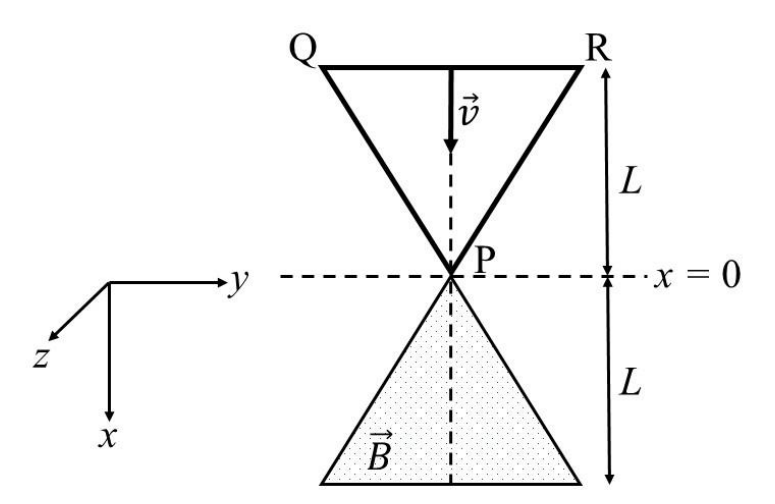
A region in the form of an equilateral triangle (in x-y plane) of height L has a uniform magnetic field B pointing in the +z-direction. A conducting loop PQR, in the form of an equilateral triangle of the same height L, is placed in the x-y plane with its vertex P at x=0 in the orientation shown in the figure. At t=0, the loop starts entering the region of the magnetic field with a uniform velocity v along the +x-direction. The plane of the loop and its orientation remain unchanged throughout its motion.
Which of the following graph best depicts the variation of the induced emf (E) in the loop as a function of the distance (x) starting from x=0?
Answer and worked solution
Official answer: A
Let x be the distance moved by P, and ξ the distance below the line x=0.
Widths. At depth ξ:
the field triangle (apex at x=0) has width 32ξ for 0≤ξ≤L;
the loop (vertex at x, base at x−L) has width 32(x−ξ).
Both are centred on the same axis, so the overlap width is 32min(ξ,x−ξ).
0 < x < L. The overlap spans 0≤ξ≤x: A=32⋅4x2,dxdA=3x.
L < x < 2L. The overlap spans x−L≤ξ≤L: A=32[4x2−(x−L)2],dxdA=32(2L−23x).
x > 2L. The loop has fully left the field region, so A=0.
emf.E=−BvdxdA:
It falls linearly from 0 to −3BvL at x=L.
It then rises linearly, crossing zero at x=34L, to +32BvL at x=2L. That is twice the size of the minimum.