PARAGRAPH "I"
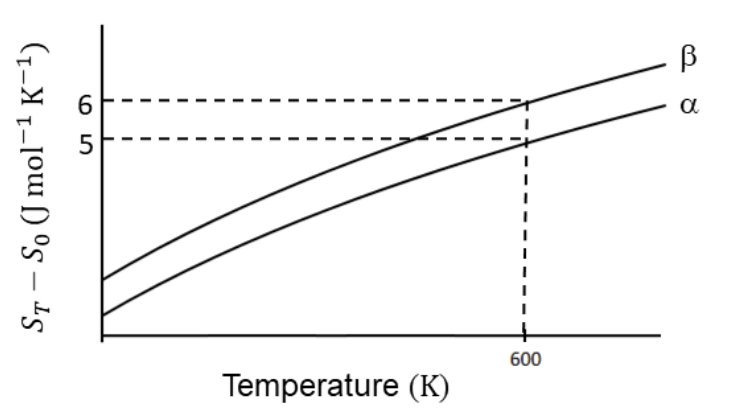
The entropy versus temperature plot for phases α and β at 1 bar pressure is given. and are entropies of the phases at temperatures T and 0 K, respectively.
The transition temperature for α to β phase change is 600 K and . Assume is independent of temperature in the range of 200 to 700 K. and are heat capacities of α and β phases, respectively.