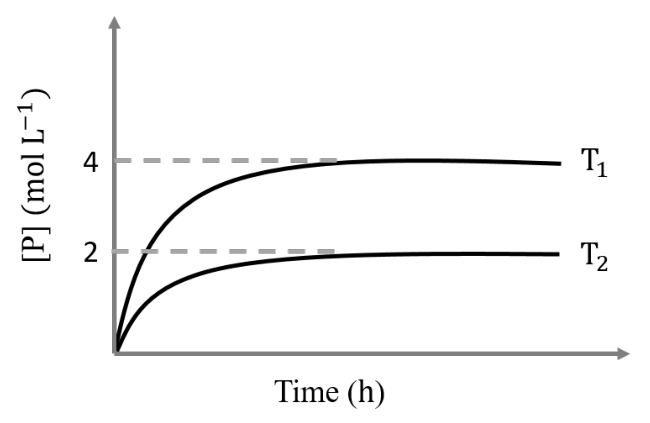
In a one-litre flask, 6 moles of A undergoes the reaction . The progress of product formation at two temperatures (in Kelvin), and , is shown in the figure:
If and , then the value of x is _____.
[ and are standard Gibb's free energy change for the reaction at temperatures and , respectively.]