The given graphs / data I, II, III and IV represent general trends observed for different physisorption and chemisorption processes under mild conditions of temperature and pressure. Which of the following choice(s) about I, II, III and IV is (are) correct?
← IIT-JEE 2012 · Paper 2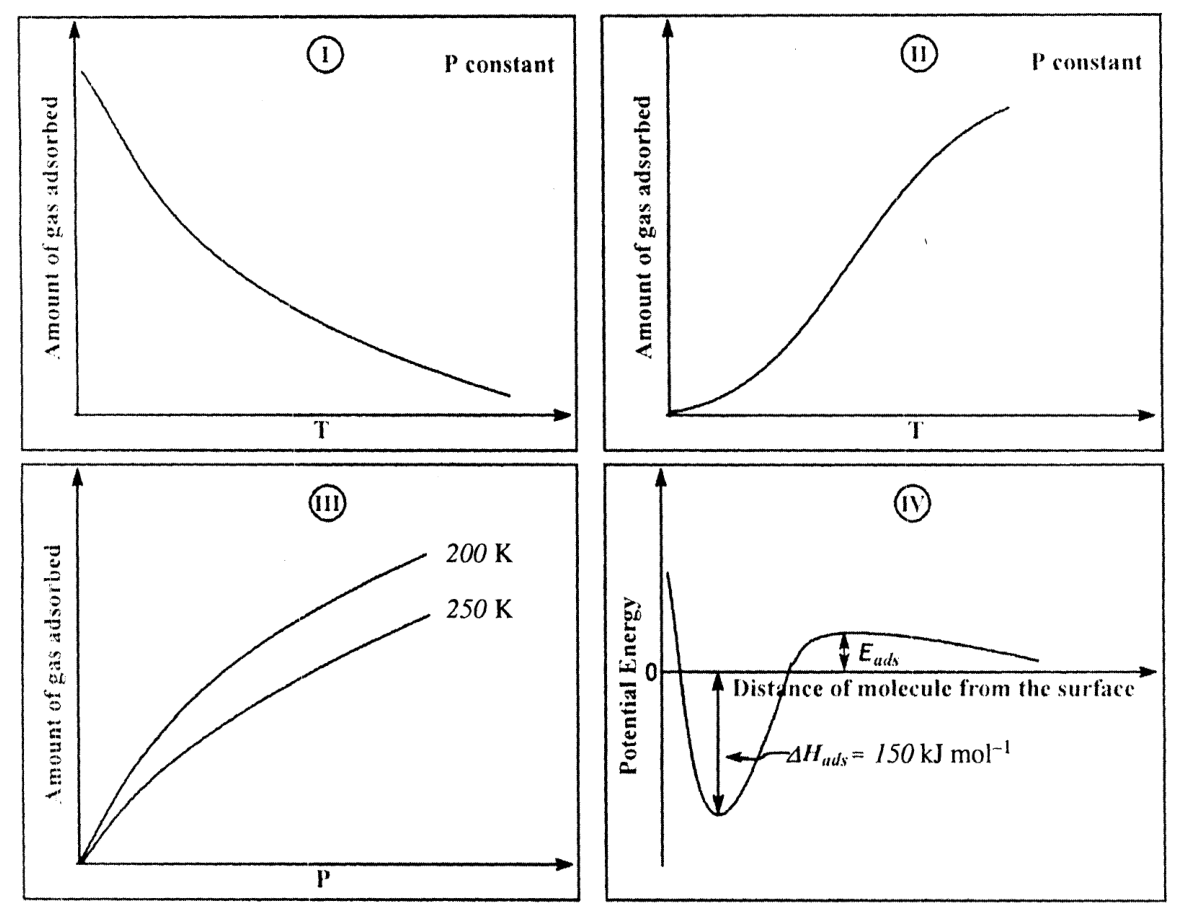
ChemistryMultiple correct+4Question 36 of 60
IIT-JEE 2012 · Paper 2, Chemistry question 36
Answer and worked solution
Official answer: A, C
Reading the graphs.
I: the amount adsorbed falls steadily as temperature rises (exothermic, no activation): physisorption.
II: the amount first rises with temperature (an activation energy must be overcome) and then falls: chemisorption.
III: more is adsorbed at 200 K than at 250 K at every pressure: physisorption.
IV: an activation barrier and a deep well of 150 kJ mol⁻¹ (bond-like enthalpy): chemisorption.
(A) I physi, II chemi. True.
(B) III is not chemisorption. False.
(C) IV and II both chemisorption. True.
(D) III is not chemisorption. False.
(A), (C)
Topics:Adsorption